NeoScreener by Neostox

NeoScreener for Stocks, Futures & Options.

The market has too many stocks, futures and options to watch one by one. NeoScreener scans across them and brings the top gainers or losers to one screen — so you can quickly see where the movement is and decide what deserves a closer look.

Choose what you want to see: all instruments, stocks, futures or options. Then narrow it further when you want to focus only on NIFTY 50 or BANK NIFTY derivatives.

One screen. The market’s biggest movers. Less searching.

Explore NeoScreener
NeoScreener showing top gainers and losers with instrument filters

You Shouldn’t Need Five Different Screens Just to See What’s Moving.

Suppose you want to know what is happening in the market. You could open a stock screener, then check futures, then options, then search NIFTY derivatives, then BANK NIFTY — and only then start opening individual charts.

Or you can begin with one simple question: What is moving the most right now? That is what NeoScreener is designed to answer.

Stocks Options Futures NIFTY BANK NIFTY
NeoScreener Top Gainers / Losers

Find the movement first. Study it next.

See the Whole Market — or Focus Only on What You Trade.

Not every trader wants to scan the same instruments. NeoScreener lets you start with the broader market and then quickly narrow the list.

Step 1 — Direction

Step 2 — Instrument

Step 3 — Universe

Result

Top 30 Gainers · All Instruments · All Market
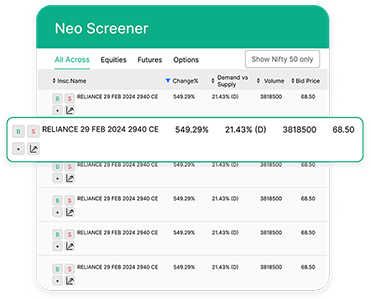
NeoScreener filtered results

A Big Move Gets Your Attention. The Details Tell You What You’re Looking At.

NeoScreener does more than rank instruments by percentage movement. Each row gives you the basic information you may want before deciding whether to investigate further.

  1. Symbol & Name What exactly is moving?
  2. Change % vs Previous Close Movement relative to yesterday’s close.
  3. Change % vs Today’s Open What has happened since the session began.
  4. Volume How much activity is behind the move.
  5. Bid & Ask Current prices buyers and sellers are quoting.
  6. Parent & Parent Change % What the underlying stock or index is doing.

Up From Yesterday Doesn’t Always Mean Up Today.

An instrument can be strongly positive compared with yesterday’s close and still be falling from today’s open — or almost unchanged from yesterday while making a strong move since the session started.

Previous Close ₹100
Today’s Open ₹110
Current Price ₹106

Vs Previous Close

+6% Still up from yesterday

Vs Today’s Open

-3.64% Down since today’s open

Example provided only to explain the two change calculations.

Same instrument. Same price. Two very different pieces of information.

An Option Can Move 30%. But What Is the Underlying Doing?

Options and futures do not move in isolation. When a derivative appears among the biggest movers, you will often want to know what is happening in the underlying stock or index.

Derivative

BANKNIFTY XXXXX CE +28.4%

Parent

BANK NIFTY +1.1%

Illustrative numbers only.

The derivative tells you what moved. The parent helps give the move context.

NeoScreener Is the Starting Point — Not the Trading Decision.

A stock at the top of the gainers list does not automatically make it a Buy. NeoScreener helps answer: “Where should I look?” The next step is still yours.

  1. ScanSee the top gainers or losers.
  2. FilterFocus on the instrument type or market you care about.
  3. UnderstandLook at movement, volume, Bid/Ask and the parent.
  4. ChartStudy what is actually happening.
  5. DecideDecide whether there is anything worth practicing.
  6. PracticePractice the trade with virtual money on Neostox.

The screener finds the movement. You decide whether the movement means anything.

Start With the Question You Want the Market to Answer.

What Stocks Are Moving the Most?

Gainers / Losers + Stocks

Top stock movers matching your selected view.

What Is Happening in BANK NIFTY Options?

Options + BANK NIFTY

Top gainers or losers within that focused universe.

Show Me Movement Across Everything.

All Instruments

Stocks, futures and options together in one list.

Movement Is Information. It Is Not a Recommendation.

NeoScreener Helps You

  • See top gainers and losers
  • Scan stocks, futures and options together
  • Focus on a specific instrument type
  • Narrow derivatives to NIFTY 50 or BANK NIFTY
  • Compare movement from previous close and today’s open
  • View volume, Bid and Ask
  • Understand the parent stock or index movement

NeoScreener Does Not Tell You

  • That a gainer will continue going up
  • That a loser will continue falling
  • That an instrument must be bought or sold
  • That a large percentage move is automatically a trading opportunity

NeoScreener identifies instruments based on price movement and selected filters. The information is intended for market analysis and practice and should not be considered a recommendation to buy or sell any security or derivative.

Quick FAQ

NeoScreener Questions

NeoScreener is a market scanner inside Neostox that shows the top gainers or losers matching your selected filters across stocks, futures and options.

NeoScreener displays the top 30 movers matching the selected view and filters.

Yes. You can choose All, Stocks, Futures or Options.

Yes. The available filters allow you to narrow the derivatives view when you want to focus specifically on these markets.

It compares the current price with the previous trading day's closing price.

It compares the current price with the current trading day's opening price. This helps you understand what the instrument has done since the present session began.

Yes. Volume is displayed as part of the screener information, and NeoScreener displays the Bid and Ask for the listed instrument.

For derivatives, the Parent helps you identify the underlying stock or index associated with the instrument. NeoScreener also shows the percentage change of the parent so you can view the derivative movement in context.

No. NeoScreener highlights market movement based on the selected view. It does not recommend that an instrument should be bought or sold. Use the information as a starting point for your own analysis.

Find Where the Movement Is

Stop Searching the Market One Screen at a Time.

See the top movers. Narrow the market. Understand what is happening. Then open the chart and decide whether anything deserves your attention.

Explore NeoScreener on Neostox